Debugging on TSCC
The following describes a basic setup of a DDT debugging session. The procedure diverges between steps 9 & 10, where the option to start a job from the queue using the debugger or to attach to an already running process is presented.
Step-by-Step Tutorial
Follow this procedure to learn debugging on TSCC using DDT
- Login to TSCC with X11 forwarding turned on (-X option to ssh command)
- Run this command to set up your environment:
module load ddt
This is equivalent to putting this line in your
.bash_profilefile:export DDT_LICENSE_FILE=/opt/ddt/License.clientand then running this command to reload the current shell environment:
. ~/.bash_profile - Make sure your code is compiled with optimization turned off by compiling with
-O0(that is capital letter "O" followed by number zero), and symbol table information enabled by compiling with the-goption - Run this command to start the DDT client:
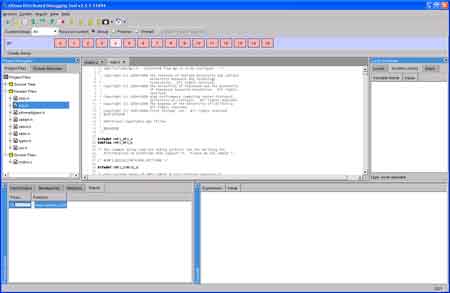
/opt/ddt/bin/ddt - To start a debugging session, from the "Session" menu select "New Session" and then "Run" from the submenu.
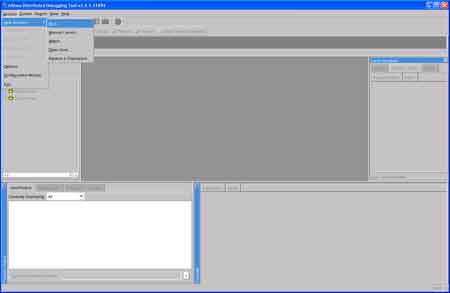
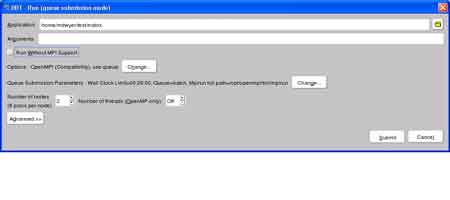
- In the "Run" window, enter the full path to the executable in the "Application" field and any command line arguments in the "Arguments" field.

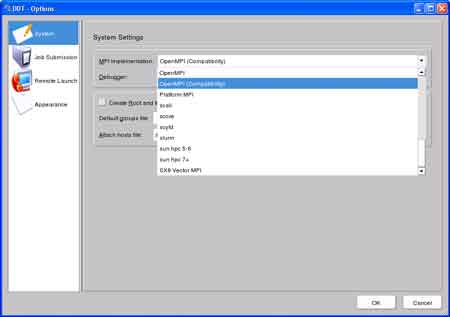
- In the "Run" window, click the "Change" button to bring up the Options window. On the "System Settings" tab, select the proper "MPI Implementation", or select "generic" if you encounter a problem while debugging. Select "none" to debug a serial or non-mpi code.
- If you are running an interactive debugging job or plan to attach to a running job, specify a hosts file in the "Attach hosts file" field and add host names to that file, one line per host.
- To submit a job for debugging through the queue:
- Still in the "Options" window, click on the "Job Submission" tab.
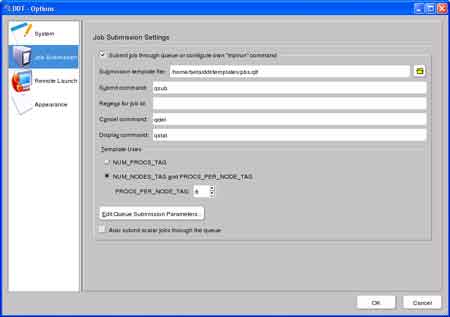
- Check "Submit job through queue or configure own 'mpirun' command".
- To use the predefined template for a PBS (TORQUE) job, click browse (the folder icon) and select the
/opt/ddt/templates/pbs.qtffile. - In the "Submit command" field, enter
qsub. Leave the "Regexp for job id" field blank. In the "Cancel command" field, enterqdel. In the "Display command" field, enterqstat. - Check the "NUM_NODES_TAG and PROCS_PER_NODE" box, and enter "8" in the "PROC_PER_NODE_TAG" field (standard for the batch queue).
- Click on the "Edit Queue Submission Parameters..." button to bring up the "Queue Submission Parameters" window.
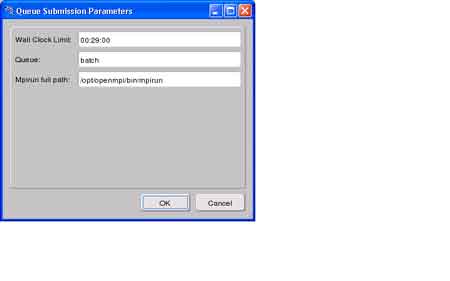
- Enter the wall clock time limit (in HH:MM:SS format) and the queue name. If you are using mpi, enter the full path to
mpirun. - Click "OK" to return to the Options window, then click OK in the Options window to return to the Run window.
- In the Run window, select the number of nodes you want to allocate and the select the "Submit" button.
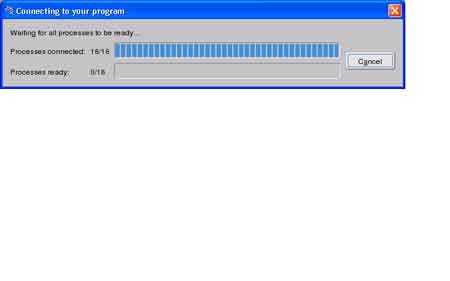
- Wait for the jobs to start...
- Enjoy!
- Still in the "Options" window, click on the "Job Submission" tab.
- To attach to a running job:
- from the "Session" menu, select "New session" and then "Attach" from the submenu.
- In the field "Filter for process names containing" enter the name of the executable (just the name is sufficient, do not enter the full path).
- Based on the the host names in the host file (see step 9), DDT will scan the specified hosts for processes with the given name and attempt to attach to them. If you have submitted a job to the queue, obtain the host list from (for example) checkjob <job number>.
Note:
You can download the DDT User Guide from the Allinea web site.